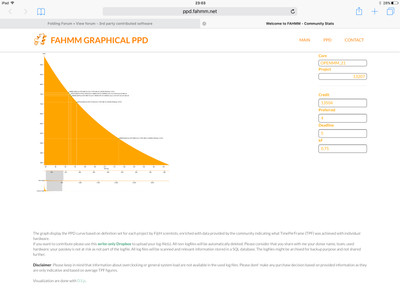
Therefore I created a database and a front end to visualize the PPD graph adding hardware/TPF data from the community.
Thanks to those donors already provided some log files earlier.
Here now a first public beta version: http://ppd.fahmm.net

Give it a shot and try it. I still expect some issues with usability as I don't have many different browser installed or lack of certain OS. Feedback of issues is always welcome.
But even more: I would need to ask your help and provide me your log files to collect the required information. Old files, lot files, few files. CPU, GPU, different OS. Whatever you can share is highly appreciated. I have a write-only Dropbox link on the page above you could use to upload. For the time being this is a manual process ; but I'm working on a write-only sFTP setup allowing a script-based upload in a more automatic manner and other client tools.
As for privacy: with the transfer of your log file your share with me your donor name, team affiliation, used hardware and OS etc. whatever is in the log file. The good thing is: your passkey remain safe as it is masked in the logs and no personal email address exists in the files.
I put all those data into a database and get a summarized/anonymous dataset out and place it as JSON on the server to visualize.
Keep folding (and start sharing your logs)
