Page 1 of 1

HOWTO: Linux Dashboard to monitor GPU, CPU temps and more

Posted: Wed Jun 24, 2020 5:43 pm
by agent71
Overview

Dashboarding for Linux Mint 19, Ubuntu 18.04 with NVIDIA GPUs. Also now tested on Mint 18/Ubuntu 16. "TIG" stack can be installed on Windows too but this guide does not cover it.

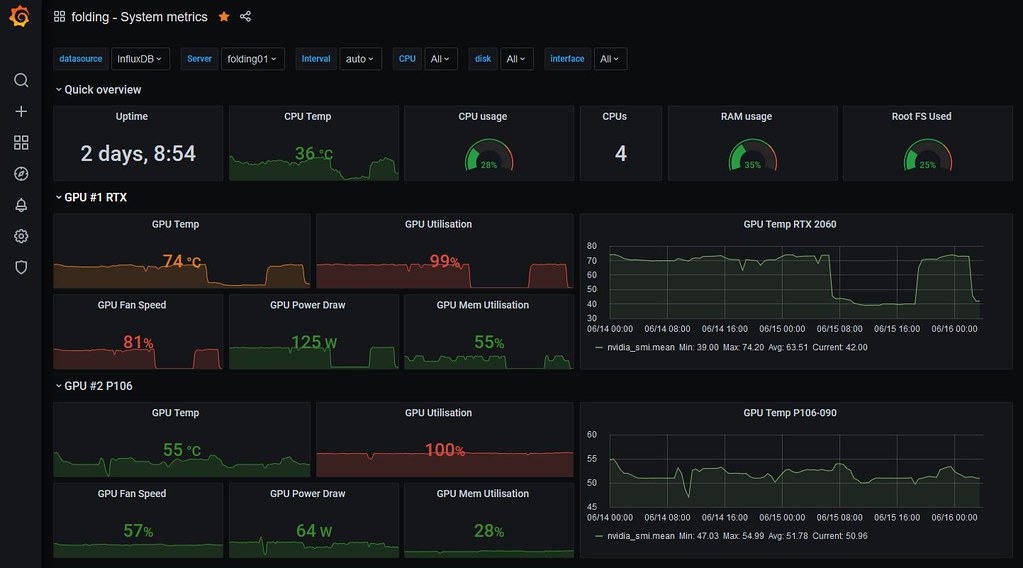
Using widely used open source tooling I'll explain how to setup and configure your Linux folding system to record system metrics and graph into easily understandable dashboards available via your browser.

NOTE: Guide not tested on any other version of Linux other than those stated.

I'm hoping this will be useful for the wider community as since lock down I've a lot of spare time late in the evenings have learnt how to set this up and monitor my folding system. Hopefully others will find it useful.

If it looks complex it really isn't. 20+ commands from command line and about 15 minutes of work end to end to install the 3 products and configure from step 1 to 4. It can take some time to configure your dashboard how you want it but 15 minutes to get your first simple dashboard.

NOTE: Support for AMD GPUs looks weak in Telegraf. When I setup on Windows PC with AMD GPU I could not see how to enable GPU metric collecton. Metrics are captured via "plugins" on Telegraf so possible that'll change for AMD if plugin update released?


Our folding systems run hot and push the limits of the components so it makes sense to monitor they are running within what we deem acceptable limits. Those will vary per person and system but if you don't know what your system is doing how can you make a judgement? And who really loves running multiple commands to get info when you can see it all on one dashboard. With a dashboard you can track what's happening now, what happened a few hours ago or weeks and months ago.

Also if you install Telegraf on each server you can configure that to point to a single InfluxDB and have all your servers monitored via a single screen. Although I don't cover that on this guide you can have all your servers on a single screen or have them selectable via a drop down.

There are various options but I'll document the "TIG" stack which is Telegraf, InfluxDB and Grafana. There are alternatives - "TICK" stack for example is Telegraf, InfluxDB, Chronograf and Kapacitor. In TICK Chronograf is your dashboarding software and an alternative for Grafana. Kapacitor is alerting should you breach thresholds eg: temperature. Alerting is available in Grafana and plenty sufficient for my needs. Also.... we use Grafana at work so an easy decision.
Image

Telegraf : An agent for collecting, processing, aggregating, and writing metrics
InfluxDB : An open-source time series database
Grafana : Dashboarding suite

Flow:
Telegraf collects the stats and stores timestamped metrics in InfluxDB and Grafana plots, graphs from InfluxDB source.

Install:
Setup InfluxDB first as required for Telegraf configuration. Grafana last once Telegraf feed to InfluxDB setup.

Re: HOWTO: Dashboard to monitor GPU and CPU temps

Posted: Wed Jun 24, 2020 5:44 pm
by agent71
Overall installation process is just 20+ commands.

Code: Select all

sudo curl -sL https://repos.influxdata.com/influxdb.key | sudo apt-key add -
source /etc/lsb-release
echo "deb https://repos.influxdata.com/${DISTRIB_ID,,} ${DISTRIB_CODENAME} stable" | sudo tee /etc/apt/sources.list.d/influxdb.list
sudo apt update
sudo apt install influxdb -y
influx
--- run from within influx command line
create database telegraf
create user telegraf with password '<ENTER_A_PASSWORD_OF_YOUR_CHOICE>'
show databases
show users
--- exit from influx
sudo apt install telegraf -y
sudo systemctl start telegraf
sudo systemctl enable telegraf
vi /etc/telegraf/telegraf.conf
sudo systemctl restart telegraf
sudo curl https://packagecloud.io/gpg.key | sudo apt-key add -
echo 'deb https://packagecloud.io/grafana/stable/debian/ stretch main' > /etc/apt/sources.list.d/grafana.list
sudo apt update
sudo apt install grafana -y
sudo systemctl start grafana-server
sudo systemctl enable grafana-server
Detailed process now follows....

STEP 1

Install and configure InfluxDB

Configure Influx repo and install InfluxDB. InfluxDB is an open source database for storing time series data. Just the sort we need for logging metrics and reporting on graphs.
https://www.influxdata.com/products/influxdb-overview/

InfluxDB and Telegraf are supplied via same repo. so we need to add that to our host.

Code: Select all

sudo curl -sL https://repos.influxdata.com/influxdb.key | sudo apt-key add -
source /etc/lsb-release
echo "deb https://repos.influxdata.com/${DISTRIB_ID,,} ${DISTRIB_CODENAME} stable" | sudo tee /etc/apt/sources.list.d/influxdb.list
sudo apt update
sudo apt install influxdb -y
Once installed enable InfluxDB to start at system boot

Code: Select all

sudo systemctl start influxdb
sudo systemctl enable influxdb
Check InfluxDB is LISTENing on ports 8086 and 8088

Code: Select all

netstat -plntu | grep 808
Should output similar to
@folding01:~$ sudo netstat -plntu | grep 808
tcp6 0 0 :::8086 :::* LISTEN 1150/influxd
tcp6 0 0 :::8088 :::* LISTEN 1150/influxd
@folding01:~$
If ports 8086 and 8088 show "LISTEN" continue if not troubleshoot your InfluxDB installation before progressing.

Create database in InfluxDB for Telegraf. If you've any exposure to SQL this'll feel similar. From command line run "influx"

Code: Select all

influx
You should be prompted with something similar:
Visit https://enterprise.influxdata.com to register for updates, InfluxDB server management, and monitoring.
Connected to http://localhost:8086 version 1.1.1
InfluxDB shell version: 1.1.1
Within InfluxDB command line run the following commands and enter a password of your chosing. This will be used to secure the DB and note that'll be displayed in plain text.

Code: Select all

create database telegraf
create user telegraf with password '<ENTER_A_PASSWORD_OF_YOUR_CHOICE>'

Code: Select all

show databases
show users
Should result in similar output.
@folding01:~$ influx
Visit https://enterprise.influxdata.com to register for updates, InfluxDB server management, and monitoring.
Connected to http://localhost:8086 version 1.1.1
InfluxDB shell version: 1.1.1
> show databases
name: databases
name
----
_internal
telegraf

> show users
user admin
---- -----
telegraf false

>
If you've got this far then InfluxDB is setup and running and proceed to next step.

Re: HOWTO: Dashboard to monitor GPU and CPU temps

Posted: Wed Jun 24, 2020 5:45 pm
by agent71
STEP 2

Install and configure Telegraf Agent

Telegraf is the metrics collector. It takes feeds from vmstat and nvidia-smi, amongst others, and feeds them to our InfluxDB instance.

Repo for Telegraf is same as InfluxDB as supplied by same company so can just install.

Code: Select all

sudo apt install telegraf -y
New configure Telegraf to start at boot time

Code: Select all

sudo systemctl start telegraf
sudo systemctl enable telegraf
Check Telegraf is running with following command and you should get similar output.

Code: Select all

@folding01:~$ sudo systemctl status telegraf
● telegraf.service - The plugin-driven server agent for reporting metrics into InfluxDB
   Loaded: loaded (/lib/systemd/system/telegraf.service; enabled; vendor preset: enabled)
   Active: active (running) since Wed 2020-06-17 17:05:52 BST; 19min ago
     Docs: https://github.com/influxdata/telegraf
 Main PID: 1148 (telegraf)
    Tasks: 17 (limit: 4915)
   CGroup: /system.slice/telegraf.service
           └─1148 /usr/bin/telegraf -config /etc/telegraf/telegraf.conf -config-directory /etc/telegraf/telegraf.d

Jun 17 17:05:52 folding01 systemd[1]: Started The plugin-driven server agent for reporting metrics into InfluxDB.
Jun 17 17:05:52 folding01 telegraf[1148]: 2020-06-17T16:05:52Z I! Starting Telegraf 1.14.3
Jun 17 17:05:52 folding01 telegraf[1148]: 2020-06-17T16:05:52Z I! Loaded inputs: cpu disk net system netstat processes diskio mem swap kernel nvidia_smi sensors
Jun 17 17:05:52 folding01 telegraf[1148]: 2020-06-17T16:05:52Z I! Loaded aggregators:
Jun 17 17:05:52 folding01 telegraf[1148]: 2020-06-17T16:05:52Z I! Loaded processors:
Jun 17 17:05:52 folding01 telegraf[1148]: 2020-06-17T16:05:52Z I! Loaded outputs: influxdb
Jun 17 17:05:52 folding01 telegraf[1148]: 2020-06-17T16:05:52Z I! Tags enabled: host=folding01
Jun 17 17:05:52 folding01 telegraf[1148]: 2020-06-17T16:05:52Z I! [agent] Config: Interval:15s, Quiet:false, Hostname:"folding01", Flush Interval:15s
Jun 17 17:05:52 folding01 telegraf[1148]: 2020-06-17T16:05:52Z W! [outputs.influxdb] When writing to [http://127.0.0.1:8086]: database "telegraf" creation failed: Post http://127.0.0.1:8086/query: dial tcp 127.0.0.1:8086: co
@folding01:~$
Now configure Telegraf. Telegraf uses "plugins" but so far as I can tell not in the sense that you download and install a new plugin and configure it. The plugin is there already in Telegraf - all you do is configure/enable plugin via its config file. Took me ages to realise that as I battled trying to work out how to install a plugin for Nvidia-smi.

Be aware that the password you enter for your InfluxDB must of course match what you set about and will be in plain text in the file.

Note that it's the line [[inputs.nvidia_smi]] that enables nvidia-smi metrics capture.

Also whilst Telegraf, InfluxDB and Grafana are all on one machine in my setup and I can use localhost for network address you could configure [[outputs.influxdb]] to feed an off server InfluxDB if you have multiple servers.

Take a safe copy of existing config.

Code: Select all

cd /etc/telegraf/
mv telegraf.conf telegraf.conf.default
I'm old school so use vi to create a new telegraf.conf and populate with:

Code: Select all

# Global Agent Configuration
[agent]
  hostname = "folding01"
  flush_interval = "15s"
  interval = "15s"


# Input Plugins
[[inputs.cpu]]
    percpu = true
    totalcpu = true
    collect_cpu_time = false
    report_active = false
[[inputs.disk]]
    ignore_fs = ["tmpfs", "devtmpfs", "devfs"]
[[inputs.io]]
[[inputs.mem]]
[[inputs.net]]
[[inputs.system]]
[[inputs.swap]]
[[inputs.netstat]]
[[inputs.processes]]
[[inputs.kernel]]

# Pulls statistics from nvidia GPUs attached to the host
[[inputs.nvidia_smi]]
  ## Optional: path to nvidia-smi binary, defaults to $PATH via exec.LookPath
  # bin_path = "/usr/bin/nvidia-smi"

  ## Optional: timeout for GPU polling
  # timeout = "5s"

# Monitor sensors, requires lm-sensors package
[[inputs.sensors]]
## Remove numbers from field names.
## If true, a field name like 'temp1_input' will be changed to 'temp_input'.
remove_numbers = true

## Timeout is the maximum amount of time that the sensors command can run.
timeout = "5s"

# Output Plugin InfluxDB
[[outputs.influxdb]]
  database = "telegraf"
  urls = [ "http://127.0.0.1:8086" ]
  username = "telegraf"
  password = "<ENTER_YOUR_INFLUXDB_PASSWORD>"
Restart Telegraf to ensure your configuration file is free from errors. If not correct it before continuing.

Code: Select all

sudo systemctl restart telegraf
Test Telegraf with following command to show CPU stats.

Code: Select all

sudo telegraf -test -config /etc/telegraf/telegraf.conf --input-filter cpu
Should give similar output.
@folding01:/etc/telegraf$
2020-06-17T16:46:03Z I! Starting Telegraf 1.14.3
> cpu,cpu=cpu0,host=folding01 usage_guest=0,usage_guest_nice=0,usage_idle=100,usage_iowait=0,usage_irq=0,usage_nice=0,usage_softirq=0,usage_steal=0,usage_system=0,usage_user=0 1592412364000000000
> cpu,cpu=cpu1,host=folding01 usage_guest=0,usage_guest_nice=0,usage_idle=0,usage_iowait=0,usage_irq=0,usage_nice=100,usage_softirq=0,usage_steal=0,usage_system=0,usage_user=0 1592412364000000000
> cpu,cpu=cpu2,host=folding01 usage_guest=0,usage_guest_nice=0,usage_idle=96.00000000000364,usage_iowait=0,usage_irq=0,usage_nice=0,usage_softirq=0,usage_steal=0,usage_system=4.000000000000625,usage_user=0 1592412364000000000
> cpu,cpu=cpu3,host=folding01 usage_guest=0,usage_guest_nice=0,usage_idle=100,usage_iowait=0,usage_irq=0,usage_nice=0,usage_softirq=0,usage_steal=0,usage_system=0,usage_user=0 1592412364000000000
> cpu,cpu=cpu-total,host=folding01 usage_guest=0,usage_guest_nice=0,usage_idle=74.24242424238527,usage_iowait=0,usage_irq=0,usage_nice=25.25252525250762,usage_softirq=0,usage_steal=0,usage_system=0.5050505050511285,usage_user=0 1592412364000000000
@folding01:/etc/telegraf$
Or GPU info with...

Code: Select all

sudo telegraf -test -config /etc/telegraf/telegraf.conf --input-filter nvidia_smi
@folding01:/etc/telegraf$ sudo telegraf -test -config /etc/telegraf/telegraf.conf --input-filter nvidia_smi
2020-06-17T16:48:00Z I! Starting Telegraf 1.14.3
> nvidia_smi,compute_mode=Default,host=folding01,index=0,name=GeForce\ RTX\ 2060,pstate=P8,uuid=GPU-86b332fd-20f0-b082-dfce-b829c2d91745 clocks_current_graphics=300i,clocks_current_memory=405i,clocks_current_sm=300i,clocks_current_video=540i,encoder_stats_average_fps=0i,encoder_stats_average_latency=0i,encoder_stats_session_count=0i,fan_speed=0i,memory_free=5903i,memory_total=5934i,memory_used=31i,pcie_link_gen_current=1i,pcie_link_width_current=16i,power_draw=11.02,temperature_gpu=41i,utilization_gpu=0i,utilization_memory=0i 1592412481000000000
> nvidia_smi,compute_mode=Default,host=folding01,index=1,name=P106-090,pstate=P0,uuid=GPU-419f9ec2-53c9-2c62-4396-f325b37b2e4b clocks_current_graphics=1809i,clocks_current_memory=4006i,clocks_current_sm=1809i,clocks_current_video=1620i,encoder_stats_average_fps=0i,encoder_stats_average_latency=0i,encoder_stats_session_count=0i,fan_speed=59i,memory_free=2907i,memory_total=3021i,memory_used=114i,pcie_link_gen_current=1i,pcie_link_width_current=4i,power_draw=69.69,temperature_gpu=56i,utilization_gpu=94i,utilization_memory=31i 1592412481000000000
@folding01:/etc/telegraf$
If you've got this far you've configured your time series InfluxDB database where you'll store all your metrics and you've setup Telegraf to feed those metrics to InfluxDB including metrics from your GPUs.

Next part is Grafana installation, configuration and dashboard creation.

Re: HOWTO: Dashboard to monitor GPU and CPU temps

Posted: Wed Jun 24, 2020 5:46 pm
by agent71
STEP 3

Install and configure Grafana

NOTE: These instructions work fine for Mint 19/Ubuntu 18.04. For Mint 18 and Ubuntu 16.04 they do not. Instead follow these instructions for installation of Grafana viewtopic.php?f=14&t=35607&p=337902#p337902

You can either download and install Grafana from their site https://grafana.com/grafana/download and manually update when required or add a repo like packagecloud.io so apt-get update keeps your package up to date.

If former instructions are on Grafana site at https://grafana.com/grafana/download

Or... add packagecloud.io repo and install via

Code: Select all

sudo curl https://packagecloud.io/gpg.key | sudo apt-key add -
echo 'deb https://packagecloud.io/grafana/stable/debian/ stretch main' > /etc/apt/sources.list.d/grafana.list
Update repo and install

Code: Select all

sudo apt update
sudo apt install grafana -y
Configure Grafana to start at system boot

Code: Select all

sudo systemctl start grafana-server
sudo systemctl enable grafana-server
Confirm Grafana startup and listening on default port of 3000.

Code: Select all

@folding01:/etc/telegraf$ sudo netstat -plntu | grep 3000
tcp6       0      0 :::3000                 :::*                    LISTEN      1418/grafana-server
@folding01:/etc/telegraf$
Test UI by accessing via browser at IP address of your server on port 3000

eg: http://192.168.1.100:3000/ or http://localhost:3000 if browser running from your Linux desktop.

And you should see login screen similar to below.
Login with the default user 'admin' and password 'admin'.

Image

Re: HOWTO: Dashboard to monitor GPU and CPU temps

Posted: Wed Jun 24, 2020 5:47 pm
by agent71
STEP 4

Add InfluxDB to Grafana and create our first dashboard

Add our InfluxDB as a data source for Grafana
https://grafana.com/docs/grafana/latest ... ta-source/
Grafana is a graphing tool. It need to be fed data and we do that via adding "data sources". There can be one or many and from multiple varied sources. We're using InfluxDB though.

Login to Grafana via your browser using the following URL

Code: Select all

http://<IP_OF_HOST_YOU_INSTALL_GRAFANA_ON>:3000
Once logged into Grafana configure a data source via the left hand panel Configuration->Data Sources
Image

and "Add data source" and select "InfluxDB" from within the Time Series Database list.

In the data source configuration panel add the following:

Code: Select all

Name: influxdb                               (It can be anything but influxdb make sense to me. Also set "Default" radio button on as this is your only data source
URL:    http://localhost:8086/         I'm using localhost as InfluxDB and Grafana are hosted on the same host. If InfluxDB elsewhere use that public IP
And in the "InfluxDB" section configure the following:

Code: Select all

Database: telegraf
User: telegraf
Password: <PASSWORD_YOU_SETUP_IN_STEP_1>
At the bottom of the configuration page there will be the option to "Save & Test"

If you do that and all ok then the TIG stack is complete.

You have a database setup, Telegraf is feeding metrics to it and Grafana is installed.

All that remains is to configure a dashboard within Grafana to view the metrics.


Create a dashboard
Within Grafana click on the + button in left panel and select create Dashboard.

Image


In the query select InfuxDB as the source and update the following:

Code: Select all

FROM default nvidia_smi where index = 0      (Zero being the index of your GPU and what "nvidia-smi -L" returns)
eg:

Code: Select all

@folding01:~$ nvidia-smi -L
GPU 0: GeForce RTX 2060 (UUID: GPU-86b332fd-20f0-b082-dfce-b829c2d91745)
GPU 1: P106-090 (UUID: GPU-419f9ec2-53c9-2c62-4396-f325b37b2e4b)
@folding01:~$

Code: Select all

SELECT field(temperature_gpu) last()
And leave everything else default. It should look like this and everything is point and click..

Image

On the right hand side select Panel tab and select Visualisation "Stat"

Image

Also on right hand select Field tab and add any temperature thresholds for your GPU as well as setting Unit to Celsius (C)

Image

Click "Save" in top right and you should now have your first metric reporting on your first dashboard.
Image


There is LOADS more you can do with Grafana, drop downs within dashboards, variables to avoid hard coding GPUs into panels and using those variables for panel titles etc. and a whole host more. I'm not going to describe those here but would instead recommend Googling Grafana how to's etc. and playing on their demo site.

Play site
https://play.grafana.org/

Dashboard how to
https://www.youtube.com/watch?v=4qpI4T6_bUw

Re: HOWTO: Dashboard to monitor GPU and CPU temps

Posted: Wed Jun 24, 2020 5:48 pm
by agent71
Ok.... seems like Mint 18/Ubuntu 16.04 has A LOT of repo issues so if you want to install this on those older versions follow the below instead of previous step 3.

If running on Mint 18 do not follow STEP 3 to install Grafana. Instead follow method below.

https://grafana.com/grafana/download

Code: Select all

sudo apt-get install -y adduser libfontconfig1
wget https://dl.grafana.com/oss/release/grafana_7.0.3_amd64.deb
sudo dpkg -i grafana_7.0.3_amd64.deb
For example...

Code: Select all

@kieron-VirtualBox ~/Downloads $ wget https://dl.grafana.com/oss/release/grafana_7.0.3_amd64.deb
--2020-06-18 21:48:01--  https://dl.grafana.com/oss/release/grafana_7.0.3_amd64.deb
Resolving dl.grafana.com (dl.grafana.com)... 151.101.62.217, 2a04:4e42:f::729
Connecting to dl.grafana.com (dl.grafana.com)|151.101.62.217|:443... connected.
HTTP request sent, awaiting response... 200 OK
Length: 49387092 (47M) [application/x-debian-package]
Saving to: ‘grafana_7.0.3_amd64.deb.1’

grafana_7.0.3_amd64 100%[===================>]  47.10M  6.67MB/s    in 8.6s    

2020-06-18 21:48:09 (5.48 MB/s) - ‘grafana_7.0.3_amd64.deb.1’ saved [49387092/49387092]

@kieron-VirtualBox ~/Downloads $ 
Install with...

Code: Select all

@kieron-VirtualBox ~/Downloads $ sudo dpkg -i grafana_7.0.3_amd64.deb
Selecting previously unselected package grafana.
(Reading database ... 196499 files and directories currently installed.)
Preparing to unpack grafana_7.0.3_amd64.deb ...
Unpacking grafana (7.0.3) ...
Setting up grafana (7.0.3) ...
### NOT starting on installation, please execute the following statements to configure grafana to start automatically using systemd
 sudo /bin/systemctl daemon-reload
 sudo /bin/systemctl enable grafana-server
### You can start grafana-server by executing
 sudo /bin/systemctl start grafana-server
Processing triggers for ureadahead (0.100.0-19.1) ...
Processing triggers for systemd (229-4ubuntu17) ...
@kieron-VirtualBox ~/Downloads $ 
Configure to start automatically on boot with the following as in the output above...

Code: Select all

@kieron-VirtualBox ~/Downloads $ sudo /bin/systemctl daemon-reload
@kieron-VirtualBox ~/Downloads $ sudo /bin/systemctl enable grafana-serverSynchronizing state of grafana-server.service with SysV init with /lib/systemd/systemd-sysv-install...
Executing /lib/systemd/systemd-sysv-install enable grafana-server
@kieron-VirtualBox ~/Downloads $ sudo /bin/systemctl start grafana-server
@kieron-VirtualBox ~/Downloads $ 

...and Grafana 7.0.3 installed and running on Mint 18.
Image