Page 3 of 5
Re: GTX 780 & Core 17 problems
Posted: Thu Jul 25, 2013 9:16 pm
by DocJonz
Update:
I'm now running the two GTX 780's on different Win7 machines with driver 320.49.
On one, the machine seems to throw out a bad WU every 36hrs (has done 3 now) - I managed to be in the right place at the right time for the last one, and a Windows message read "display driver nVidia Windows kernel mode driver, version 320.49 stopped responding and has successfully recovered" - though Windows continued running, it seemed to corrupt the WU and carry on. Warnings/Errors below - first WU error is different to the next two;
Code: Select all
*********************** Log Started 2013-07-21T08:33:04Z ***********************
08:33:36:WARNING:Exception: 9:127.0.0.1: Send error: 10053: An established connection was aborted by the software in your host machine.
08:33:38:WARNING:Exception: 10:127.0.0.1: Send error: 10053: An established connection was aborted by the software in your host machine.
******************************* Date: 2013-07-21 *******************************
******************************* Date: 2013-07-21 *******************************
******************************* Date: 2013-07-22 *******************************
******************************* Date: 2013-07-22 *******************************
******************************* Date: 2013-07-22 *******************************
20:22:48:WU01:FS00:0x17:ERROR:exception: Error invoking kernel finishSpreadCharge: clEnqueueNDRangeKernel (-5)
20:22:48:WARNING:WU01:FS00:FahCore returned: BAD_WORK_UNIT (114 = 0x72)
******************************* Date: 2013-07-22 *******************************
******************************* Date: 2013-07-23 *******************************
******************************* Date: 2013-07-23 *******************************
******************************* Date: 2013-07-23 *******************************
******************************* Date: 2013-07-23 *******************************
******************************* Date: 2013-07-24 *******************************
08:13:26:WU01:FS00:0x17:ERROR:exception: Error downloading array energyBuffer: clEnqueueReadBuffer (-36)
08:13:27:WARNING:WU01:FS00:FahCore returned: BAD_WORK_UNIT (114 = 0x72)
******************************* Date: 2013-07-24 *******************************
******************************* Date: 2013-07-24 *******************************
******************************* Date: 2013-07-24 *******************************
******************************* Date: 2013-07-25 *******************************
******************************* Date: 2013-07-25 *******************************
******************************* Date: 2013-07-25 *******************************
******************************* Date: 2013-07-25 *******************************
******************************* Date: 2013-07-25 *******************************
20:50:58:WU02:FS00:0x17:ERROR:exception: Error downloading array energyBuffer: clEnqueueReadBuffer (-36)
20:50:59:WARNING:WU02:FS00:FahCore returned: BAD_WORK_UNIT (114 = 0x72)
The other machine has dropped out once so far, with the same first WU error as the other machine. Warnings/Errors below;
Code: Select all
*********************** Log Started 2013-07-23T06:29:01Z ***********************
06:30:18:WARNING:Exception: 8:127.0.0.1: Send error: 10053: An established connection was aborted by the software in your host machine.
06:30:20:WARNING:Exception: 9:127.0.0.1: Send error: 10053: An established connection was aborted by the software in your host machine.
******************************* Date: 2013-07-23 *******************************
******************************* Date: 2013-07-23 *******************************
******************************* Date: 2013-07-24 *******************************
******************************* Date: 2013-07-24 *******************************
******************************* Date: 2013-07-24 *******************************
18:19:10:WU01:FS00:0x17:ERROR:exception: Error invoking kernel finishSpreadCharge: clEnqueueNDRangeKernel (-5)
18:19:11:WARNING:WU01:FS00:FahCore returned: BAD_WORK_UNIT (114 = 0x72)
******************************* Date: 2013-07-24 *******************************
******************************* Date: 2013-07-25 *******************************
******************************* Date: 2013-07-25 *******************************
******************************* Date: 2013-07-25 *******************************
******************************* Date: 2013-07-25 *******************************
Re: GTX 780 & Core 17 problems
Posted: Thu Jul 25, 2013 9:55 pm
by ChristianVirtual
I changed the PSU to a Seasonic 1050 with a huge single 12V rail; still have an issue with the 780 after about two days working; with Ubuntu 13.04 and xorg-edgers 319 driver.. The system become very laggy; GUI is not responding at all; shell via ssh is also slow.
The TPF gets quite long; more than 5 min; still crunching; but very slow.

In the log file there is nothing special:
Code: Select all
16:33:34:WU00:FS00:Started FahCore on PID 8590
16:33:34:WU00:FS00:Core PID:8594
16:33:34:WU00:FS00:FahCore 0x17 started
16:33:34:WU00:FS00:0x17:*********************** Log Started 2013-07-25T16:33:34Z ***********************
16:33:34:WU00:FS00:0x17:Project: 7810 (Run 0, Clone 454, Gen 8)
16:33:34:WU00:FS00:0x17:Unit: 0x000000090a3b1e8651d34ac90a99b0f7
16:33:34:WU00:FS00:0x17:CPU: 0x00000000000000000000000000000000
16:33:34:WU00:FS00:0x17:Machine: 0
16:33:34:WU00:FS00:0x17:Reading tar file state.xml
16:33:34:WU00:FS00:0x17:Reading tar file system.xml
16:33:34:WU00:FS00:0x17:Reading tar file integrator.xml
16:33:34:WU00:FS00:0x17:Reading tar file core.xml
16:33:34:WU00:FS00:0x17:Digital signatures verified
16:33:41:WU02:FS00:Upload 84.97%
16:33:49:WU02:FS00:Upload complete
16:33:49:WU02:FS00:Server responded WORK_ACK (400)
16:33:49:WU02:FS00:Final credit estimate, 10404.00 points
16:33:49:WU02:FS00:Cleaning up
16:44:59:WU00:FS00:0x17:Completed 0 out of 2000000 steps (0%)
16:47:31:WU00:FS00:0x17:Completed 20000 out of 2000000 steps (1%)
16:49:39:WU00:FS00:0x17:Completed 40000 out of 2000000 steps (2%)
16:51:23:WU00:FS00:0x17:Completed 60000 out of 2000000 steps (3%)
16:53:30:WU00:FS00:0x17:Completed 80000 out of 2000000 steps (4%)

16:59:07:WU00:FS00:0x17:Completed 100000 out of 2000000 steps (5%)

17:00:51:WU00:FS00:0x17:Completed 120000 out of 2000000 steps (6%)
17:02:58:WU00:FS00:0x17:Completed 140000 out of 2000000 steps (7%)
17:04:42:WU00:FS00:0x17:Completed 160000 out of 2000000 steps (8%)
17:06:50:WU00:FS00:0x17:Completed 180000 out of 2000000 steps (9%)
17:08:27:WU00:FS00:0x17:Completed 200000 out of 2000000 steps (10%)
17:11:41:WU00:FS00:0x17:Completed 220000 out of 2000000 steps (11%)
17:13:18:WU00:FS00:0x17:Completed 240000 out of 2000000 steps (12%)
17:15:33:WU00:FS00:0x17:Completed 260000 out of 2000000 steps (13%)
17:17:40:WU00:FS00:0x17:Completed 280000 out of 2000000 steps (14%)
17:19:17:WU00:FS00:0x17:Completed 300000 out of 2000000 steps (15%)
17:21:31:WU00:FS00:0x17:Completed 320000 out of 2000000 steps (16%)
17:23:38:WU00:FS00:0x17:Completed 340000 out of 2000000 steps (17%)
17:25:52:WU00:FS00:0x17:Completed 360000 out of 2000000 steps (18%)

17:30:29:WU00:FS00:0x17:Completed 380000 out of 2000000 steps (19%)

17:32:07:WU00:FS00:0x17:Completed 400000 out of 2000000 steps (20%)
17:34:21:WU00:FS00:0x17:Completed 420000 out of 2000000 steps (21%)
17:35:58:WU00:FS00:0x17:Completed 440000 out of 2000000 steps (22%)
17:38:12:WU00:FS00:0x17:Completed 460000 out of 2000000 steps (23%)
17:39:49:WU00:FS00:0x17:Completed 480000 out of 2000000 steps (24%)
17:41:57:WU00:FS00:0x17:Completed 500000 out of 2000000 steps (25%)
17:44:10:WU00:FS00:0x17:Completed 520000 out of 2000000 steps (26%)
17:45:48:WU00:FS00:0x17:Completed 540000 out of 2000000 steps (27%)
17:48:02:WU00:FS00:0x17:Completed 560000 out of 2000000 steps (28%)
17:50:09:WU00:FS00:0x17:Completed 580000 out of 2000000 steps (29%)

17:55:16:WU00:FS00:0x17:Completed 600000 out of 2000000 steps (30%)

17:57:30:WU00:FS00:0x17:Completed 620000 out of 2000000 steps (31%)
17:59:37:WU00:FS00:0x17:Completed 640000 out of 2000000 steps (32%)
18:01:21:WU00:FS00:0x17:Completed 660000 out of 2000000 steps (33%)
18:03:28:WU00:FS00:0x17:Completed 680000 out of 2000000 steps (34%)
18:06:06:WU00:FS00:0x17:Completed 700000 out of 2000000 steps (35%)
18:07:49:WU00:FS00:0x17:Completed 720000 out of 2000000 steps (36%)
18:09:56:WU00:FS00:0x17:Completed 740000 out of 2000000 steps (37%)
18:11:40:WU00:FS00:0x17:Completed 760000 out of 2000000 steps (38%)
18:14:18:WU00:FS00:0x17:Completed 780000 out of 2000000 steps (39%)
18:16:55:WU00:FS00:0x17:Completed 800000 out of 2000000 steps (40%)
18:19:09:WU00:FS00:0x17:Completed 820000 out of 2000000 steps (41%)
18:20:46:WU00:FS00:0x17:Completed 840000 out of 2000000 steps (42%)
18:23:00:WU00:FS00:0x17:Completed 860000 out of 2000000 steps (43%)
18:25:07:WU00:FS00:0x17:Completed 880000 out of 2000000 steps (44%)
18:26:45:WU00:FS00:0x17:Completed 900000 out of 2000000 steps (45%)
18:28:58:WU00:FS00:0x17:Completed 920000 out of 2000000 steps (46%)
18:31:05:WU00:FS00:0x17:Completed 940000 out of 2000000 steps (47%)
18:33:49:WU00:FS00:0x17:Completed 960000 out of 2000000 steps (48%)
18:35:26:WU00:FS00:0x17:Completed 980000 out of 2000000 steps (49%)
18:37:34:WU00:FS00:0x17:Completed 1000000 out of 2000000 steps (50%)
18:39:48:WU00:FS00:0x17:Completed 1020000 out of 2000000 steps (51%)
18:41:55:WU00:FS00:0x17:Completed 1040000 out of 2000000 steps (52%)
18:43:39:WU00:FS00:0x17:Completed 1060000 out of 2000000 steps (53%)
18:45:46:WU00:FS00:0x17:Completed 1080000 out of 2000000 steps (54%)
18:47:54:WU00:FS00:0x17:Completed 1100000 out of 2000000 steps (55%)
18:50:07:WU00:FS00:0x17:Completed 1120000 out of 2000000 steps (56%)
18:52:15:WU00:FS00:0x17:Completed 1140000 out of 2000000 steps (57%)
18:53:59:WU00:FS00:0x17:Completed 1160000 out of 2000000 steps (58%)

18:58:36:WU00:FS00:0x17:Completed 1180000 out of 2000000 steps (59%)

19:00:13:WU00:FS00:0x17:Completed 1200000 out of 2000000 steps (60%)
19:02:27:WU00:FS00:0x17:Completed 1220000 out of 2000000 steps (61%)
19:04:34:WU00:FS00:0x17:Completed 1240000 out of 2000000 steps (62%)
19:06:18:WU00:FS00:0x17:Completed 1260000 out of 2000000 steps (63%)
19:08:26:WU00:FS00:0x17:Completed 1280000 out of 2000000 steps (64%)
19:10:33:WU00:FS00:0x17:Completed 1300000 out of 2000000 steps (65%)
19:12:47:WU00:FS00:0x17:Completed 1320000 out of 2000000 steps (66%)
19:15:55:WU00:FS00:0x17:Completed 1340000 out of 2000000 steps (67%)
19:17:38:WU00:FS00:0x17:Completed 1360000 out of 2000000 steps (68%)
19:19:46:WU00:FS00:0x17:Completed 1380000 out of 2000000 steps (69%)
19:21:53:WU00:FS00:0x17:Completed 1400000 out of 2000000 steps (70%)
19:24:07:WU00:FS00:0x17:Completed 1420000 out of 2000000 steps (71%)
19:24:36:FS01:Finishing
19:24:45:FS00:Finishing
19:25:44:WU00:FS00:0x17:Completed 1440000 out of 2000000 steps (72%)
19:27:58:WU00:FS00:0x17:Completed 1460000 out of 2000000 steps (73%)
19:30:35:WU00:FS00:0x17:Completed 1480000 out of 2000000 steps (74%)
19:32:13:WU00:FS00:0x17:Completed 1500000 out of 2000000 steps (75%)
19:34:27:WU00:FS00:0x17:Completed 1520000 out of 2000000 steps (76%)
19:36:34:WU00:FS00:0x17:Completed 1540000 out of 2000000 steps (77%)
19:38:47:WU00:FS00:0x17:Completed 1560000 out of 2000000 steps (78%)
19:40:25:WU00:FS00:0x17:Completed 1580000 out of 2000000 steps (79%)
19:43:02:WU00:FS00:0x17:Completed 1600000 out of 2000000 steps (80%)
19:45:46:WU00:FS00:0x17:Completed 1620000 out of 2000000 steps (81%)
19:47:53:WU00:FS00:0x17:Completed 1640000 out of 2000000 steps (82%)
19:50:07:WU00:FS00:0x17:Completed 1660000 out of 2000000 steps (83%)
19:53:14:WU00:FS00:0x17:Completed 1680000 out of 2000000 steps (84%)
19:54:52:WU00:FS00:0x17:Completed 1700000 out of 2000000 steps (85%)
19:57:05:WU00:FS00:0x17:Completed 1720000 out of 2000000 steps (86%)
19:58:43:WU00:FS00:0x17:Completed 1740000 out of 2000000 steps (87%)
20:00:56:WU00:FS00:0x17:Completed 1760000 out of 2000000 steps (88%)
20:03:04:WU00:FS00:0x17:Completed 1780000 out of 2000000 steps (89%)
20:04:41:WU00:FS00:0x17:Completed 1800000 out of 2000000 steps (90%)
20:07:25:WU00:FS00:0x17:Completed 1820000 out of 2000000 steps (91%)
20:09:33:WU00:FS00:0x17:Completed 1840000 out of 2000000 steps (92%)
20:11:16:WU00:FS00:0x17:Completed 1860000 out of 2000000 steps (93%)
20:13:24:WU00:FS00:0x17:Completed 1880000 out of 2000000 steps (94%)
20:15:31:WU00:FS00:0x17:Completed 1900000 out of 2000000 steps (95%)
20:18:45:WU00:FS00:0x17:Completed 1920000 out of 2000000 steps (96%)
20:20:52:WU00:FS00:0x17:Completed 1940000 out of 2000000 steps (97%)
20:22:35:WU00:FS00:0x17:Completed 1960000 out of 2000000 steps (98%)
20:24:43:WU00:FS00:0x17:Completed 1980000 out of 2000000 steps (99%)
20:26:50:WU00:FS00:0x17:Completed 2000000 out of 2000000 steps (100%)
20:26:57:WU00:FS00:0x17:Saving result file logfile_01.txt
20:26:57:WU00:FS00:0x17:Saving result file checkpointState.xml
20:26:58:WU00:FS00:0x17:Saving result file checkpt.crc
20:26:58:WU00:FS00:0x17:Saving result file log.txt
20:26:58:WU00:FS00:0x17:Saving result file positions.xtc
20:27:00:WU00:FS00:0x17:Folding@home Core Shutdown: FINISHED_UNIT
20:32:38:WU00:FS00:FahCore returned: FINISHED_UNIT (100 = 0x64)
20:32:38:WU00:FS00:Sending unit results: id:00 state:SEND error:NO_ERROR project:7810 run:0 clone:454 gen:8 core:0x17 unit:0x000000090a3b1e8651d34ac90a99b0f7
20:32:38:WU00:FS00:Uploading 5.78MiB to 171.64.65.98
20:32:38:WU00:FS00:Connecting to 171.64.65.98:8080
20:32:58:WU00:FS00:Upload 1.08%
20:33:06:WU00:FS00:Upload 87.63%
20:33:11:WU00:FS00:Upload complete
20:33:11:WU00:FS00:Server responded WORK_ACK (400)
20:33:11:WU00:FS00:Final credit estimate, 13169.00 points
20:33:12:WU00:FS00:Cleaning up
20:45:39:FS01:Paused
while in the system log file I get a number of message like this:
Code: Select all
Jul 26 00:12:18 linuxpowered kernel: [128842.721290] NVRM: os_schedule: Attempted to yield the CPU while in atomic or interrupt context
Jul 26 00:12:20 linuxpowered kernel: [128844.717402] NVRM: os_schedule: Attempted to yield the CPU while in atomic or interrupt context
Jul 26 00:12:22 linuxpowered kernel: [128846.713513] NVRM: os_schedule: Attempted to yield the CPU while in atomic or interrupt context
Xorg.0.log contain the following
Code: Select all
[129664.787] (WW) NVIDIA(0): WAIT (2, 8, 0x8000, 0x00003818, 0x00005384)
[129671.787] (WW) NVIDIA(0): WAIT (1, 8, 0x8000, 0x00003818, 0x00005384)
[129994.890] (WW) NVIDIA(0): WAIT (2, 8, 0x8000, 0x0000ee7c, 0x0000f47c)
[130001.890] (WW) NVIDIA(0): WAIT (1, 8, 0x8000, 0x0000ee7c, 0x0000f47c)
And even subsequent impacting a CPU-folding core on the same system
Code: Select all
Jul 26 00:12:36 linuxpowered kernel: [128861.124503] BUG: soft lockup - CPU#1 stuck for 23s! [FahCore_a3:5078]
Jul 26 00:12:36 linuxpowered kernel: [128861.124506] Modules linked in: parport_pc(F) ppdev(F) rfcomm bnep bluetooth snd_hda_codec_hdmi coretemp snd_hda_codec_realtek kvm_intel kvm ghash_clmulni_intel(F) aesni_intel(F) aes_x86_64(F) xts(F) lrw(F) gf128mul(F) ablk_helper(F) cryptd(F) snd_hda_intel snd_hda_codec snd_hwdep(F) snd_pcm(F) gpio_ich snd_page_alloc(F) nvidia(POF) snd_seq_midi(F) snd_seq_midi_event(F) snd_rawmidi(F) snd_seq(F) snd_seq_device(F) snd_timer(F) drm snd(F) mac_hid lpc_ich psmouse(F) mei soundcore(F) lp(F) parport(F) microcode(F) serio_raw(F) hid_generic usbhid hid ahci(F) libahci(F) e1000e(F)
Jul 26 00:12:36 linuxpowered kernel: [128861.124541] CPU 1
Jul 26 00:12:36 linuxpowered kernel: [128861.124545] Pid: 5078, comm: FahCore_a3 Tainted: PF          O 3.8.0-19-generic #30-Ubuntu Supermicro C7Q67/C7Q67
Any idea ?
The 780 is from Gigabyte; no overclock. The only "deviation" from factory setting is with coolbits 4 the fan control and set to 75% to keep GPU around 62C
Any idea ? Any similar experience ?
Re: GTX 780 & Core 17 problems
Posted: Thu Jul 25, 2013 10:03 pm
by bollix47
I've had a similar experience with my gtx 780(no o/c ... temps/power fine). Using the 32x.xx drivers(including the latest beta) every 36-48 hours I'd notice a mild drop in PPD and, if I didn't reboot as soon as I noticed the drop, the computer would eventually freeze up and I had to do a hard reboot(never lost a WU). This behavior occurred in Windows 7 64-bit and Linux 13.04 64-bit. In Linux, nvidia-settings would not even load once the PPD started it's drop and if I tried to load it the mouse and keyboard would stop working and only a hard reboot solved the problem.
There are lots of threads on the internet about the gtx 7xx series of GPUs and the 32x.xx drivers. Some thought it was caused by a memory leak. There was a suggestion to use 314.xx, with a modified inf file so the cards are recognized, but I've been unsuccessful at getting that to work so far.
What I'm doing now to avoid the problem is to reboot the system daily. End of problems. No slow downs and no freezing. The consensus on the web appears to be that this is driver related and hopefully it will be fixed by Nvidia soon.
Re: GTX 780 & Core 17 problems
Posted: Thu Jul 25, 2013 10:31 pm
by ChristianVirtual
@bollix47: Yes, the deep freeze I saw the other day. I lost the time of a WU; the client restarted at 0% and crunched again. Bad luck.
Seems that a frequent reboot is right now the only way. Do you know by chance a way to set the fan via shell ? I tried with nvidia-settings and smi but can't really find the right parameter. As I would like to automize the reboot I need a way to reset the fan speed.
Re: GTX 780 & Core 17 problems
Posted: Thu Jul 25, 2013 10:31 pm
by 7im
Fresh Win 7 install, fully patched, and GTX 760 with 320.xx drivers. Blue screens once a day. I set autologin, and it reboots and starts folding again.
Re: GTX 780 & Core 17 problems
Posted: Thu Jul 25, 2013 10:41 pm
by bollix47
@ChristianVirtual
Look at
this post about two thirds of the way down you'll see how I use a bash script to set the fan speed after a reboot (If you find your new fan setting does not survive a reboot ... ).
Re: GTX 780 & Core 17 problems
Posted: Thu Jul 25, 2013 10:42 pm
by bruce
Has anybody looked for a memory leak?
Re: GTX 780 & Core 17 problems
Posted: Thu Jul 25, 2013 10:47 pm
by bollix47
I've started to record memory usage (system, gpu, core_17) as well as temperatures and will check it every day around the same time (when possible) before the current WU finishes(90% to 99%), reboot after the WU finishes and check again at 2% to 4% of the next WU. Will report if I find anything of interest. The problem may not show up unless I let it run longer but then if it gets to the point where it freezes I won't be able to check the readings.

Re: GTX 780 & Core 17 problems
Posted: Fri Jul 26, 2013 12:09 am
by PantherX
Not sure if this would work but if you set-up GPU-Z to log to file and let it run, I think it just might be able to get the last data point before the crash. When you do a hard reset, you can look at the log file and see if there is any valuable data or not.
Re: GTX 780 & Core 17 problems
Posted: Fri Jul 26, 2013 12:17 am
by bollix47
Thanks for that suggestion PantherX. I'm running on Linux at the moment but will switch over in a few days and give that a try.
Re: GTX 780 & Core 17 problems
Posted: Fri Jul 26, 2013 4:24 am
by Grendel
bruce wrote:Has anybody looked for a memory leak?
Under Windows you can see it in the task manager (or better Process Explorer) -- the system process' working set memory usage keeps growing.
Here is an example.
Re: GTX 780 & Core 17 problems
Posted: Fri Jul 26, 2013 8:46 pm
by ChristianVirtual
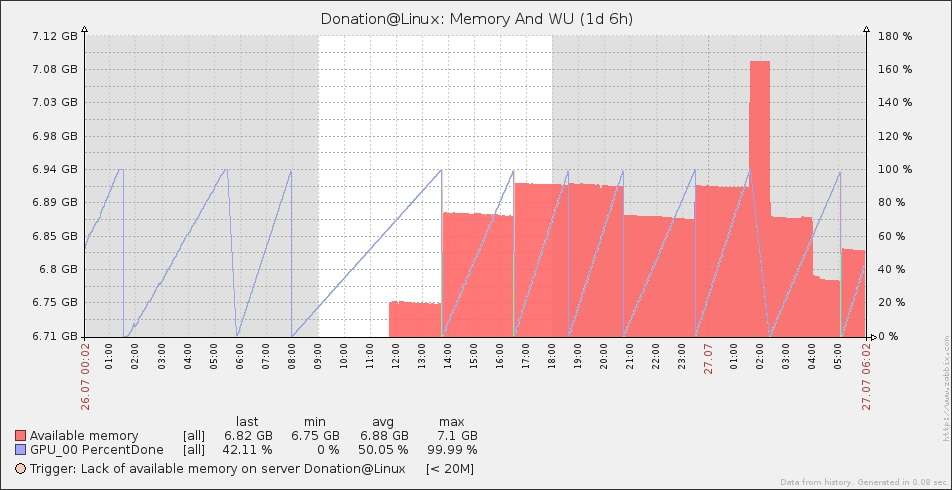
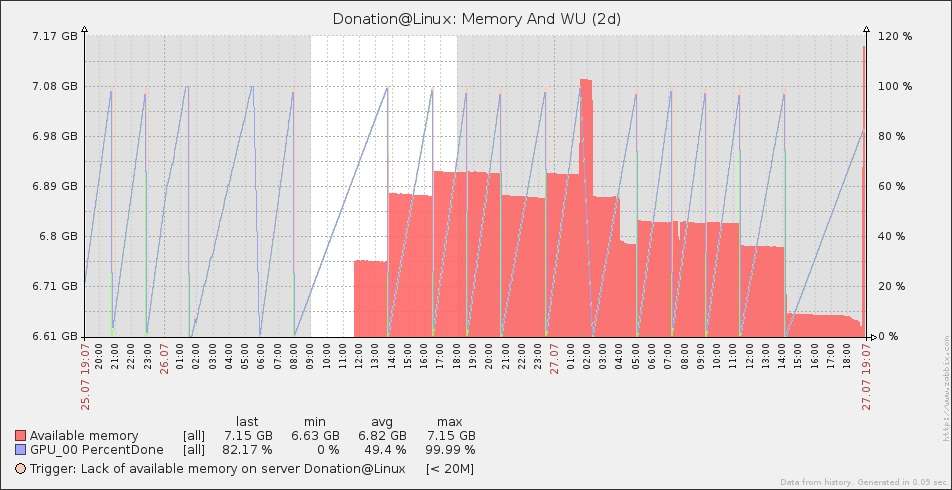
After first 12 hours in rough monitoring available memory I can't (yet) see a significant memory leak.
The red area is the available memory while the blue line indicate the percentage done of WU at that time.

Need to tweak the recording in a better detailed way.
That glitch and delay in the blue line around 2:00 am morning was the server outage.
Re: GTX 780 & Core 17 problems
Posted: Sat Jul 27, 2013 7:21 am
by Nicolas_orleans
@Christian
From below post it appears (picture and log) you are running outdated 3.8.0-19 kernel. It may help to update to latest 3.8.0-26 and reinstall 319.32 from xorg-edgers repo to be sure all modules are built against this specific one.
This 3.8.0-26 w 319.32 is working for my GTX770, though it's not the same chip.
ChristianVirtual wrote:
while in the system log file I get a number of message like this:
Code: Select all
Jul 26 00:12:18 linuxpowered kernel: [128842.721290] NVRM: os_schedule: Attempted to yield the CPU while in atomic or interrupt context
Jul 26 00:12:20 linuxpowered kernel: [128844.717402] NVRM: os_schedule: Attempted to yield the CPU while in atomic or interrupt context
Jul 26 00:12:22 linuxpowered kernel: [128846.713513] NVRM: os_schedule: Attempted to yield the CPU while in atomic or interrupt context
Xorg.0.log contain the following
Code: Select all
[129664.787] (WW) NVIDIA(0): WAIT (2, 8, 0x8000, 0x00003818, 0x00005384)
[129671.787] (WW) NVIDIA(0): WAIT (1, 8, 0x8000, 0x00003818, 0x00005384)
[129994.890] (WW) NVIDIA(0): WAIT (2, 8, 0x8000, 0x0000ee7c, 0x0000f47c)
[130001.890] (WW) NVIDIA(0): WAIT (1, 8, 0x8000, 0x0000ee7c, 0x0000f47c)
And even subsequent impacting a CPU-folding core on the same system
Code: Select all
Jul 26 00:12:36 linuxpowered kernel: [128861.124503] BUG: soft lockup - CPU#1 stuck for 23s! [FahCore_a3:5078]
Jul 26 00:12:36 linuxpowered kernel: [128861.124506] Modules linked in: parport_pc(F) ppdev(F) rfcomm bnep bluetooth snd_hda_codec_hdmi coretemp snd_hda_codec_realtek kvm_intel kvm ghash_clmulni_intel(F) aesni_intel(F) aes_x86_64(F) xts(F) lrw(F) gf128mul(F) ablk_helper(F) cryptd(F) snd_hda_intel snd_hda_codec snd_hwdep(F) snd_pcm(F) gpio_ich snd_page_alloc(F) nvidia(POF) snd_seq_midi(F) snd_seq_midi_event(F) snd_rawmidi(F) snd_seq(F) snd_seq_device(F) snd_timer(F) drm snd(F) mac_hid lpc_ich psmouse(F) mei soundcore(F) lp(F) parport(F) microcode(F) serio_raw(F) hid_generic usbhid hid ahci(F) libahci(F) e1000e(F)
Jul 26 00:12:36 linuxpowered kernel: [128861.124541] CPU 1
Jul 26 00:12:36 linuxpowered kernel: [128861.124545] Pid: 5078, comm: FahCore_a3 Tainted: PF          O 3.8.0-19-generic #30-Ubuntu Supermicro C7Q67/C7Q67
Re: GTX 780 & Core 17 problems
Posted: Sat Jul 27, 2013 10:32 am
by ChristianVirtual
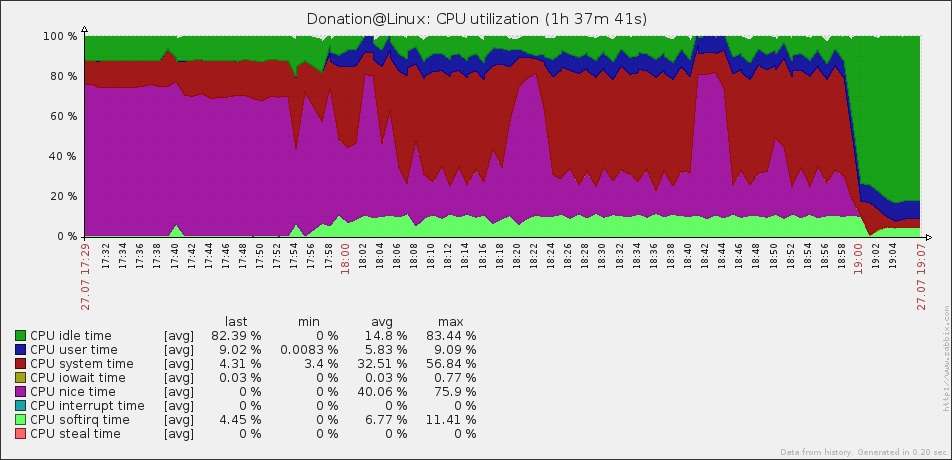
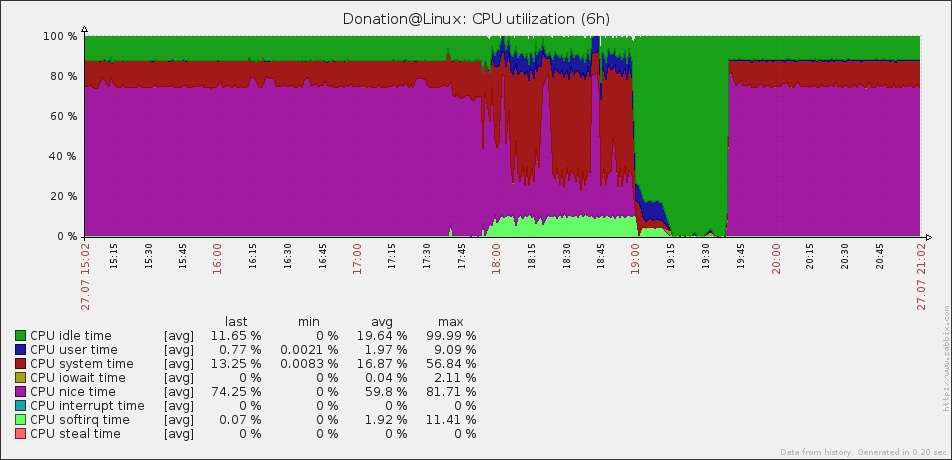
And it happen again ...
TOP showed also enough memory; interestingly one full core for Xorg.
Code: Select all
top - 18:55:21 up 1 day, 13:07,  2 users,  load average: 9.16, 9.18, 9.22
Tasks: 230 total,   4 running, 226 sleeping,   0 stopped,   0 zombie
%Cpu(s):  0.4 us, 12.1 sy, 74.3 ni, 12.9 id,  0.0 wa,  0.0 hi,  0.3 si,  0.0 st
KiB Mem:   8134468 total,  2081748 used,  6052720 free,   173956 buffers
KiB Swap:  8343548 total,        0 used,  8343548 free,   724956 cached

  PID USER      PR  NI  VIRT  RES  SHR S  %CPU %MEM    TIME+  COMMAND
11483 fahclien  39  19  444m 186m 3120 S 499.4  2.3   5307:55 FahCore_a3
 1272 root      20   0  231m  80m  38m R  96.0  1.0  71:24.82 Xorg
    1 root      20   0 26936 2728 1432 S   0.0  0.0   0:00.78 init
...
11479 fahclien  39  19 96040 1788 1548 S   0.0  0.0   0:11.36 FAHCoreWrapper
15523 fahclien  39  19 96040 1792 1548 S   0.0  0.0   0:03.23 FAHCoreWrapper
15527 fahclien  39  19 20.6g 358m  20m D   0.0  4.5 218:04.72 FahCore_17
Memory looked still ok (as per zabbix; different from TOP ??)

But system dynamics changed

TOP after restart
Code: Select all
top - 19:40:38 up 9 min,  3 users,  load average: 5.54, 1.92, 0.72
Tasks: 226 total,   2 running, 224 sleeping,   0 stopped,   0 zombie
%Cpu(s):  0.5 us,  5.8 sy, 81.7 ni, 11.9 id,  0.0 wa,  0.0 hi,  0.0 si,  0.0 st
KiB Mem:   8134468 total,  1475776 used,  6658692 free,    42372 buffers
KiB Swap:  8343548 total,        0 used,  8343548 free,   450728 cached

  PID USER      PR  NI  VIRT  RES  SHR S  %CPU %MEM    TIME+  COMMAND
 2287 fahclien  39  19  447m 182m 3000 S 596.9  2.3   8:41.14 FahCore_a3
 2292 fahclien  39  19 20.4g 277m  19m R  99.9  3.5   1:33.40 FahCore_17
 2321 cl        20   0  626m  35m  17m S   1.7  0.4   0:02.18 FAHControl
 1683 cl        20   0 1387m 115m  57m S   1.0  1.5   0:03.45 compiz
  277 root      20   0     0    0    0 S   0.3  0.0   0:00.08 kworker/5:1
 1114 root      20   0  186m  60m  30m S   0.3  0.8   0:03.67 Xorg
 1166 zabbix    20   0 92636 1988 1292 S   0.3  0.0   0:00.06 zabbix_agentd
 1728 nobody    20   0 34044 1536 1288 S   0.3  0.0   0:00.05 dnsmasq
 2276 fahclien  20   0 20.8g 9524 6448 S   0.3  0.1   0:00.42 FAHClient
 2309 cl        20   0  548m  55m  24m S   0.3  0.7   0:02.79 nvidia-settings
 2453 cl        20   0 94668 2084 1084 S   0.3  0.0   0:00.02 sshd
 2548 cl        20   0 25948 1796 1144 R   0.3  0.0   0:00.04 top
My forensic skills are limited

@Nicolas_orleans, might be a good idea to refresh the kernel; I fear it will not help ... same kernel drove before a GTX 660 TI with else identical hardware.
Re: GTX 780 & Core 17 problems
Posted: Sat Jul 27, 2013 12:04 pm
by ChristianVirtual
For comparison the CPU load after restart ...

another TOP (somehow in the way I would expect)
Code: Select all
top - 21:41:48 up  2:10,  2 users,  load average: 7.06, 7.06, 7.05
Tasks: 223 total,   3 running, 220 sleeping,   0 stopped,   0 zombie
%Cpu(s):  0.7 us,  8.2 sy, 79.4 ni, 11.7 id,  0.0 wa,  0.0 hi,  0.0 si,  0.0 st
KiB Mem:   8134468 total,  1585612 used,  6548856 free,    42676 buffers
KiB Swap:  8343548 total,        0 used,  8343548 free,   475540 cached

  PID USER      PR  NI  VIRT  RES  SHR S  %CPU %MEM    TIME+  COMMAND
 2287 fahclien  39  19  447m 184m 3036 S 598.1  2.3 732:40.45 FahCore_a3
 2292 fahclien  39  19 20.6g 358m  20m R  99.7  4.5 122:09.05 FahCore_17
 1114 root      20   0  218m  69m  39m S   2.0  0.9   3:36.92 Xorg
 1683 cl        20   0 1411m 117m  57m S   1.3  1.5   1:41.41 compiz
 2321 cl        20   0  626m  35m  17m S   1.0  0.4   2:03.13 FAHControl
 2309 cl        20   0  548m  55m  24m S   0.7  0.7   0:41.92 nvidia-settings
   80 root      20   0     0    0    0 S   0.3  0.0   0:06.72 kworker/1:1
  277 root      20   0     0    0    0 S   0.3  0.0   0:05.77 kworker/5:1

