STEP 2
Install and configure Telegraf Agent
Telegraf is the metrics collector. It takes feeds from vmstat and nvidia-smi, amongst others, and feeds them to our InfluxDB instance.
Repo for Telegraf is same as InfluxDB as supplied by same company so can just install.
New configure Telegraf to start at boot time
Code: Select all
sudo systemctl start telegraf
sudo systemctl enable telegraf
Check Telegraf is running with following command and you should get similar output.
Code: Select all
@folding01:~$ sudo systemctl status telegraf
● telegraf.service - The plugin-driven server agent for reporting metrics into InfluxDB
   Loaded: loaded (/lib/systemd/system/telegraf.service; enabled; vendor preset: enabled)
   Active: active (running) since Wed 2020-06-17 17:05:52 BST; 19min ago
     Docs: https://github.com/influxdata/telegraf
 Main PID: 1148 (telegraf)
    Tasks: 17 (limit: 4915)
   CGroup: /system.slice/telegraf.service
           └─1148 /usr/bin/telegraf -config /etc/telegraf/telegraf.conf -config-directory /etc/telegraf/telegraf.d

Jun 17 17:05:52 folding01 systemd[1]: Started The plugin-driven server agent for reporting metrics into InfluxDB.
Jun 17 17:05:52 folding01 telegraf[1148]: 2020-06-17T16:05:52Z I! Starting Telegraf 1.14.3
Jun 17 17:05:52 folding01 telegraf[1148]: 2020-06-17T16:05:52Z I! Loaded inputs: cpu disk net system netstat processes diskio mem swap kernel nvidia_smi sensors
Jun 17 17:05:52 folding01 telegraf[1148]: 2020-06-17T16:05:52Z I! Loaded aggregators:
Jun 17 17:05:52 folding01 telegraf[1148]: 2020-06-17T16:05:52Z I! Loaded processors:
Jun 17 17:05:52 folding01 telegraf[1148]: 2020-06-17T16:05:52Z I! Loaded outputs: influxdb
Jun 17 17:05:52 folding01 telegraf[1148]: 2020-06-17T16:05:52Z I! Tags enabled: host=folding01
Jun 17 17:05:52 folding01 telegraf[1148]: 2020-06-17T16:05:52Z I! [agent] Config: Interval:15s, Quiet:false, Hostname:"folding01", Flush Interval:15s
Jun 17 17:05:52 folding01 telegraf[1148]: 2020-06-17T16:05:52Z W! [outputs.influxdb] When writing to [http://127.0.0.1:8086]: database "telegraf" creation failed: Post http://127.0.0.1:8086/query: dial tcp 127.0.0.1:8086: co
@folding01:~$
Now configure Telegraf. Telegraf uses "plugins" but so far as I can tell not in the sense that you download and install a new plugin and configure it. The plugin is there already in Telegraf - all you do is configure/enable plugin via its config file. Took me ages to realise that as I battled trying to work out how to install a plugin for Nvidia-smi.
Be aware that the password you enter for your InfluxDB must of course match what you set about and will be in plain text in the file.
Note that it's the line [[inputs.nvidia_smi]] that enables nvidia-smi metrics capture.
Also whilst Telegraf, InfluxDB and Grafana are all on one machine in my setup and I can use localhost for network address you could configure [[outputs.influxdb]] to feed an off server InfluxDB if you have multiple servers.
Take a safe copy of existing config.
Code: Select all
cd /etc/telegraf/
mv telegraf.conf telegraf.conf.default
I'm old school so use vi to create a new telegraf.conf and populate with:
Code: Select all
# Global Agent Configuration
[agent]
  hostname = "folding01"
  flush_interval = "15s"
  interval = "15s"


# Input Plugins
[[inputs.cpu]]
    percpu = true
    totalcpu = true
    collect_cpu_time = false
    report_active = false
[[inputs.disk]]
    ignore_fs = ["tmpfs", "devtmpfs", "devfs"]
[[inputs.io]]
[[inputs.mem]]
[[inputs.net]]
[[inputs.system]]
[[inputs.swap]]
[[inputs.netstat]]
[[inputs.processes]]
[[inputs.kernel]]

# Pulls statistics from nvidia GPUs attached to the host
[[inputs.nvidia_smi]]
  ## Optional: path to nvidia-smi binary, defaults to $PATH via exec.LookPath
  # bin_path = "/usr/bin/nvidia-smi"

  ## Optional: timeout for GPU polling
  # timeout = "5s"

# Monitor sensors, requires lm-sensors package
[[inputs.sensors]]
## Remove numbers from field names.
## If true, a field name like 'temp1_input' will be changed to 'temp_input'.
remove_numbers = true

## Timeout is the maximum amount of time that the sensors command can run.
timeout = "5s"

# Output Plugin InfluxDB
[[outputs.influxdb]]
  database = "telegraf"
  urls = [ "http://127.0.0.1:8086" ]
  username = "telegraf"
  password = "<ENTER_YOUR_INFLUXDB_PASSWORD>"
Restart Telegraf to ensure your configuration file is free from errors. If not correct it before continuing.
Test Telegraf with following command to show CPU stats.
Code: Select all
sudo telegraf -test -config /etc/telegraf/telegraf.conf --input-filter cpu
Should give similar output.
@folding01:/etc/telegraf$
2020-06-17T16:46:03Z I! Starting Telegraf 1.14.3
> cpu,cpu=cpu0,host=folding01 usage_guest=0,usage_guest_nice=0,usage_idle=100,usage_iowait=0,usage_irq=0,usage_nice=0,usage_softirq=0,usage_steal=0,usage_system=0,usage_user=0 1592412364000000000
> cpu,cpu=cpu1,host=folding01 usage_guest=0,usage_guest_nice=0,usage_idle=0,usage_iowait=0,usage_irq=0,usage_nice=100,usage_softirq=0,usage_steal=0,usage_system=0,usage_user=0 1592412364000000000
> cpu,cpu=cpu2,host=folding01 usage_guest=0,usage_guest_nice=0,usage_idle=96.00000000000364,usage_iowait=0,usage_irq=0,usage_nice=0,usage_softirq=0,usage_steal=0,usage_system=4.000000000000625,usage_user=0 1592412364000000000
> cpu,cpu=cpu3,host=folding01 usage_guest=0,usage_guest_nice=0,usage_idle=100,usage_iowait=0,usage_irq=0,usage_nice=0,usage_softirq=0,usage_steal=0,usage_system=0,usage_user=0 1592412364000000000
> cpu,cpu=cpu-total,host=folding01 usage_guest=0,usage_guest_nice=0,usage_idle=74.24242424238527,usage_iowait=0,usage_irq=0,usage_nice=25.25252525250762,usage_softirq=0,usage_steal=0,usage_system=0.5050505050511285,usage_user=0 1592412364000000000
@folding01:/etc/telegraf$
Or GPU info with...
Code: Select all
sudo telegraf -test -config /etc/telegraf/telegraf.conf --input-filter nvidia_smi
@folding01:/etc/telegraf$ sudo telegraf -test -config /etc/telegraf/telegraf.conf --input-filter nvidia_smi
2020-06-17T16:48:00Z I! Starting Telegraf 1.14.3
> nvidia_smi,compute_mode=Default,host=folding01,index=0,name=GeForce\ RTX\ 2060,pstate=P8,uuid=GPU-86b332fd-20f0-b082-dfce-b829c2d91745 clocks_current_graphics=300i,clocks_current_memory=405i,clocks_current_sm=300i,clocks_current_video=540i,encoder_stats_average_fps=0i,encoder_stats_average_latency=0i,encoder_stats_session_count=0i,fan_speed=0i,memory_free=5903i,memory_total=5934i,memory_used=31i,pcie_link_gen_current=1i,pcie_link_width_current=16i,power_draw=11.02,temperature_gpu=41i,utilization_gpu=0i,utilization_memory=0i 1592412481000000000
> nvidia_smi,compute_mode=Default,host=folding01,index=1,name=P106-090,pstate=P0,uuid=GPU-419f9ec2-53c9-2c62-4396-f325b37b2e4b clocks_current_graphics=1809i,clocks_current_memory=4006i,clocks_current_sm=1809i,clocks_current_video=1620i,encoder_stats_average_fps=0i,encoder_stats_average_latency=0i,encoder_stats_session_count=0i,fan_speed=59i,memory_free=2907i,memory_total=3021i,memory_used=114i,pcie_link_gen_current=1i,pcie_link_width_current=4i,power_draw=69.69,temperature_gpu=56i,utilization_gpu=94i,utilization_memory=31i 1592412481000000000
@folding01:/etc/telegraf$
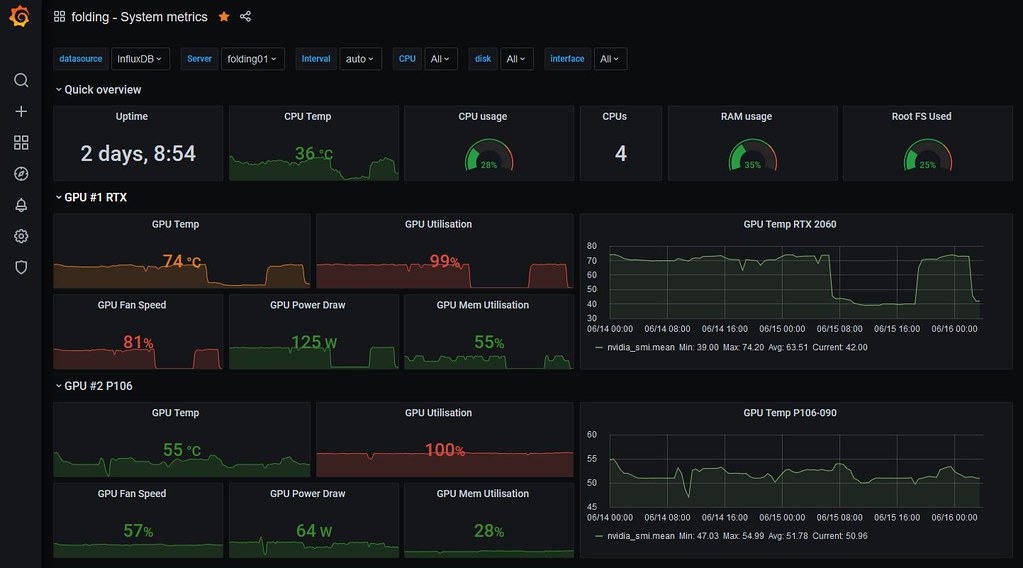
If you've got this far you've configured your time series InfluxDB database where you'll store all your metrics and you've setup Telegraf to feed those metrics to InfluxDB including metrics from your GPUs.
Next part is Grafana installation, configuration and dashboard creation.